
© Holzkurier
© Holzkurier
| Land | Importe in | Mio. US-Dollar | Diff. | Importe in | 1000 m³ | Diff. |
|---|---|---|---|---|---|---|
| 1-12 2010 | 1-12 2011 | in % | 1-12 2010 | 1-12 2011 | in % | |
| Kanada | 2.686 | 2.658 | –1 | 21.179 | 20.738 | –2 |
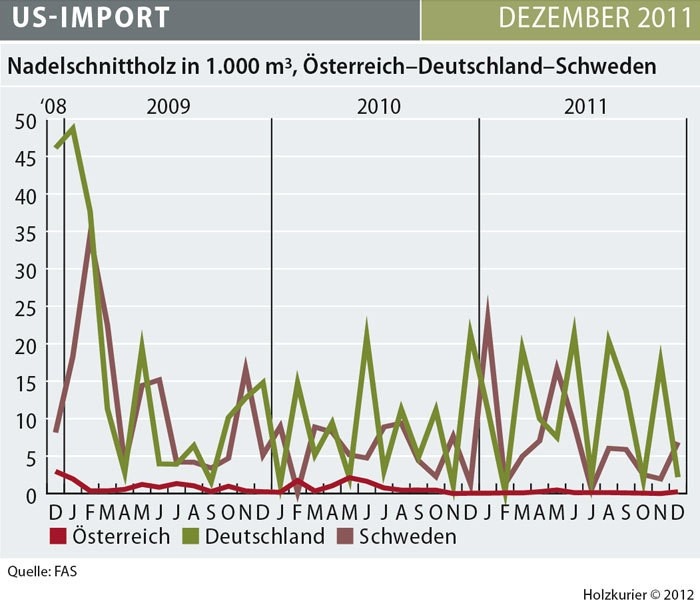
| Deutschland | 24 | 27 | 13 | 106 | 133 | 25 |
| Schweden | 28 | 28 | – | 70 | 91 | 30 |
| Tschechien | 5 | 5 | – | 22 | 22 | – |
| Litauen | 0,4 | 0,6 | 50 | 1 | 2 | 100 |
| Österreich | 2,6 | 0,5 | –81 | 9 | 1,6 | –82 |
| Finnland | 1,8 | 0,6 | –67 | 4,6 | 1,6 | –65 |
| Russland | 2 | 0,7 | –65 | 4 | 1 | –75 |
| EU 27 gesamt | 65 | 64 | –2 | 219 | 330 | 51,0 |
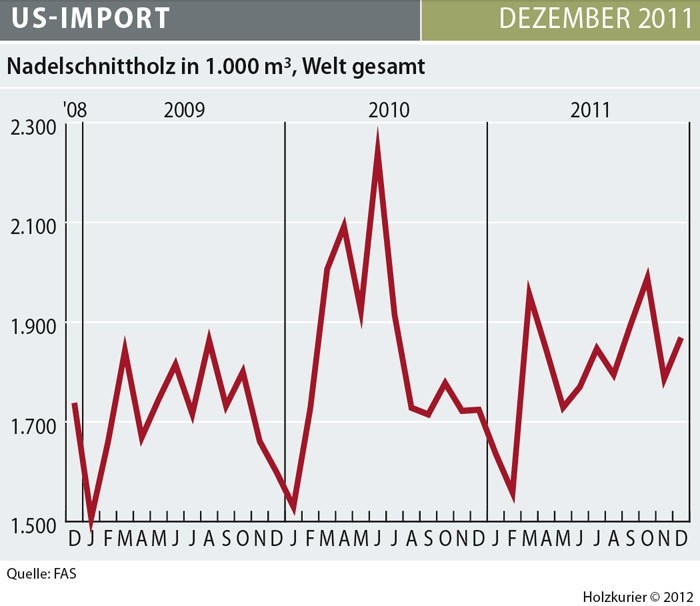
| Gesamt–Import | 3.042 | 2.988 | –2 | 22.100 | 21.674 | –2 |

